

New figures show that there has been real growth in the research and development expenditure for all the Nordic countries in 2021. Iceland and Finland had the strongest growth, followed by Denmark, Norway, and Sweden. [1]
By Adviser Anne Espeland Berg and Senior Adviser Kaja Wendt, Statistics Norway
Norway invests the least in Research and Development (R&D)
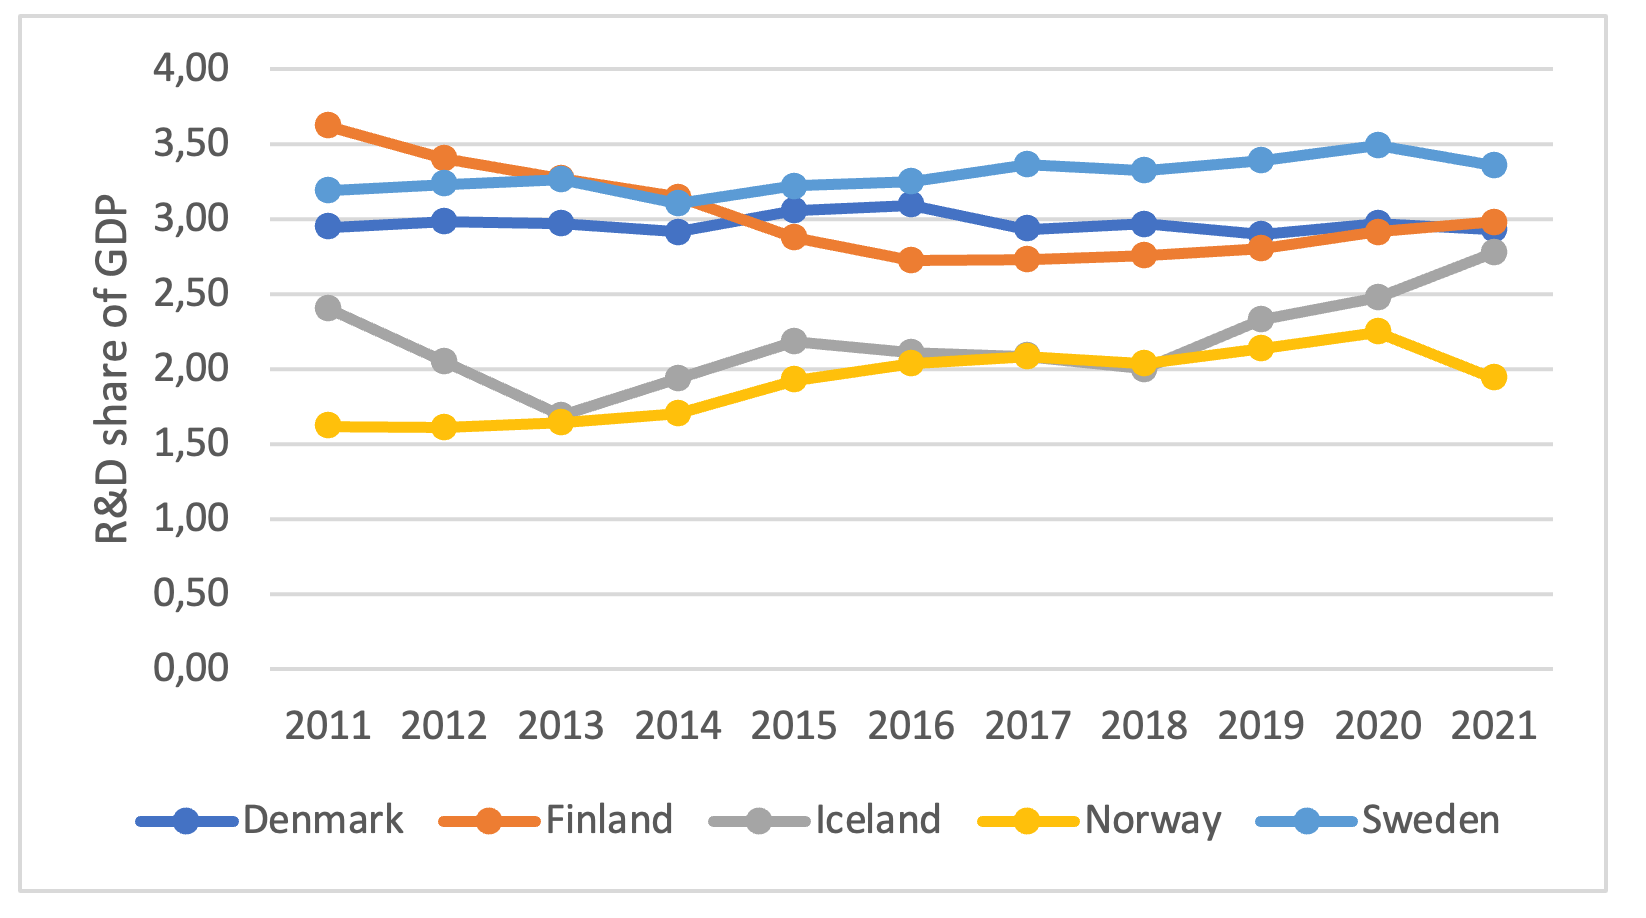
In recent years, Norway has invested the least in research and development among the Nordic countries, measured as a share of gross domestic product (GDP)[2]. In 2021, the gap between Norway and the other Nordic countries increased further. The increased gap was caused by both a decline in the Norwegian R&D share of GDP and strong growth in the Icelandic share (see Figure 1).
Norwegian R&D expenditure amounted to 1.94 per cent of GDP in 2021. In 2020, the Norwegian R&D share was as high as 2.24 per cent, meaning that there was a decrease of 0.3 percentage points from 2020 to 2021. Thus, we are now further away from reaching the political ambition that R&D expenditure should amount to 3 per cent of GDP by 2030.
While the Norwegian R&D share has decreased, there has been significant growth in the Icelandic share. In Iceland, the R&D share of GDP increased from 2.47 per cent in 2020 to 2.77 per cent in 2021. The difference in the Norwegian and the Icelandic R&D share increased from 0.23 percentage points in 2020 to 0.84 percentage points in 2021. Thus, Norway stands out compared to the other Nordic countries and has by far the lowest R&D share of GDP in 2021.
While Norway has had a strong decrease, and Iceland a strong increase, the R&D share in the remaining Nordic countries has remained relatively stable. Sweden still has the highest share with 3.36 per cent, followed by Finland (2.98 per cent) and Denmark (2.93 per cent). In comparison, the EU countries combined have an R&D share of GDP that equals 2.19 per cent.
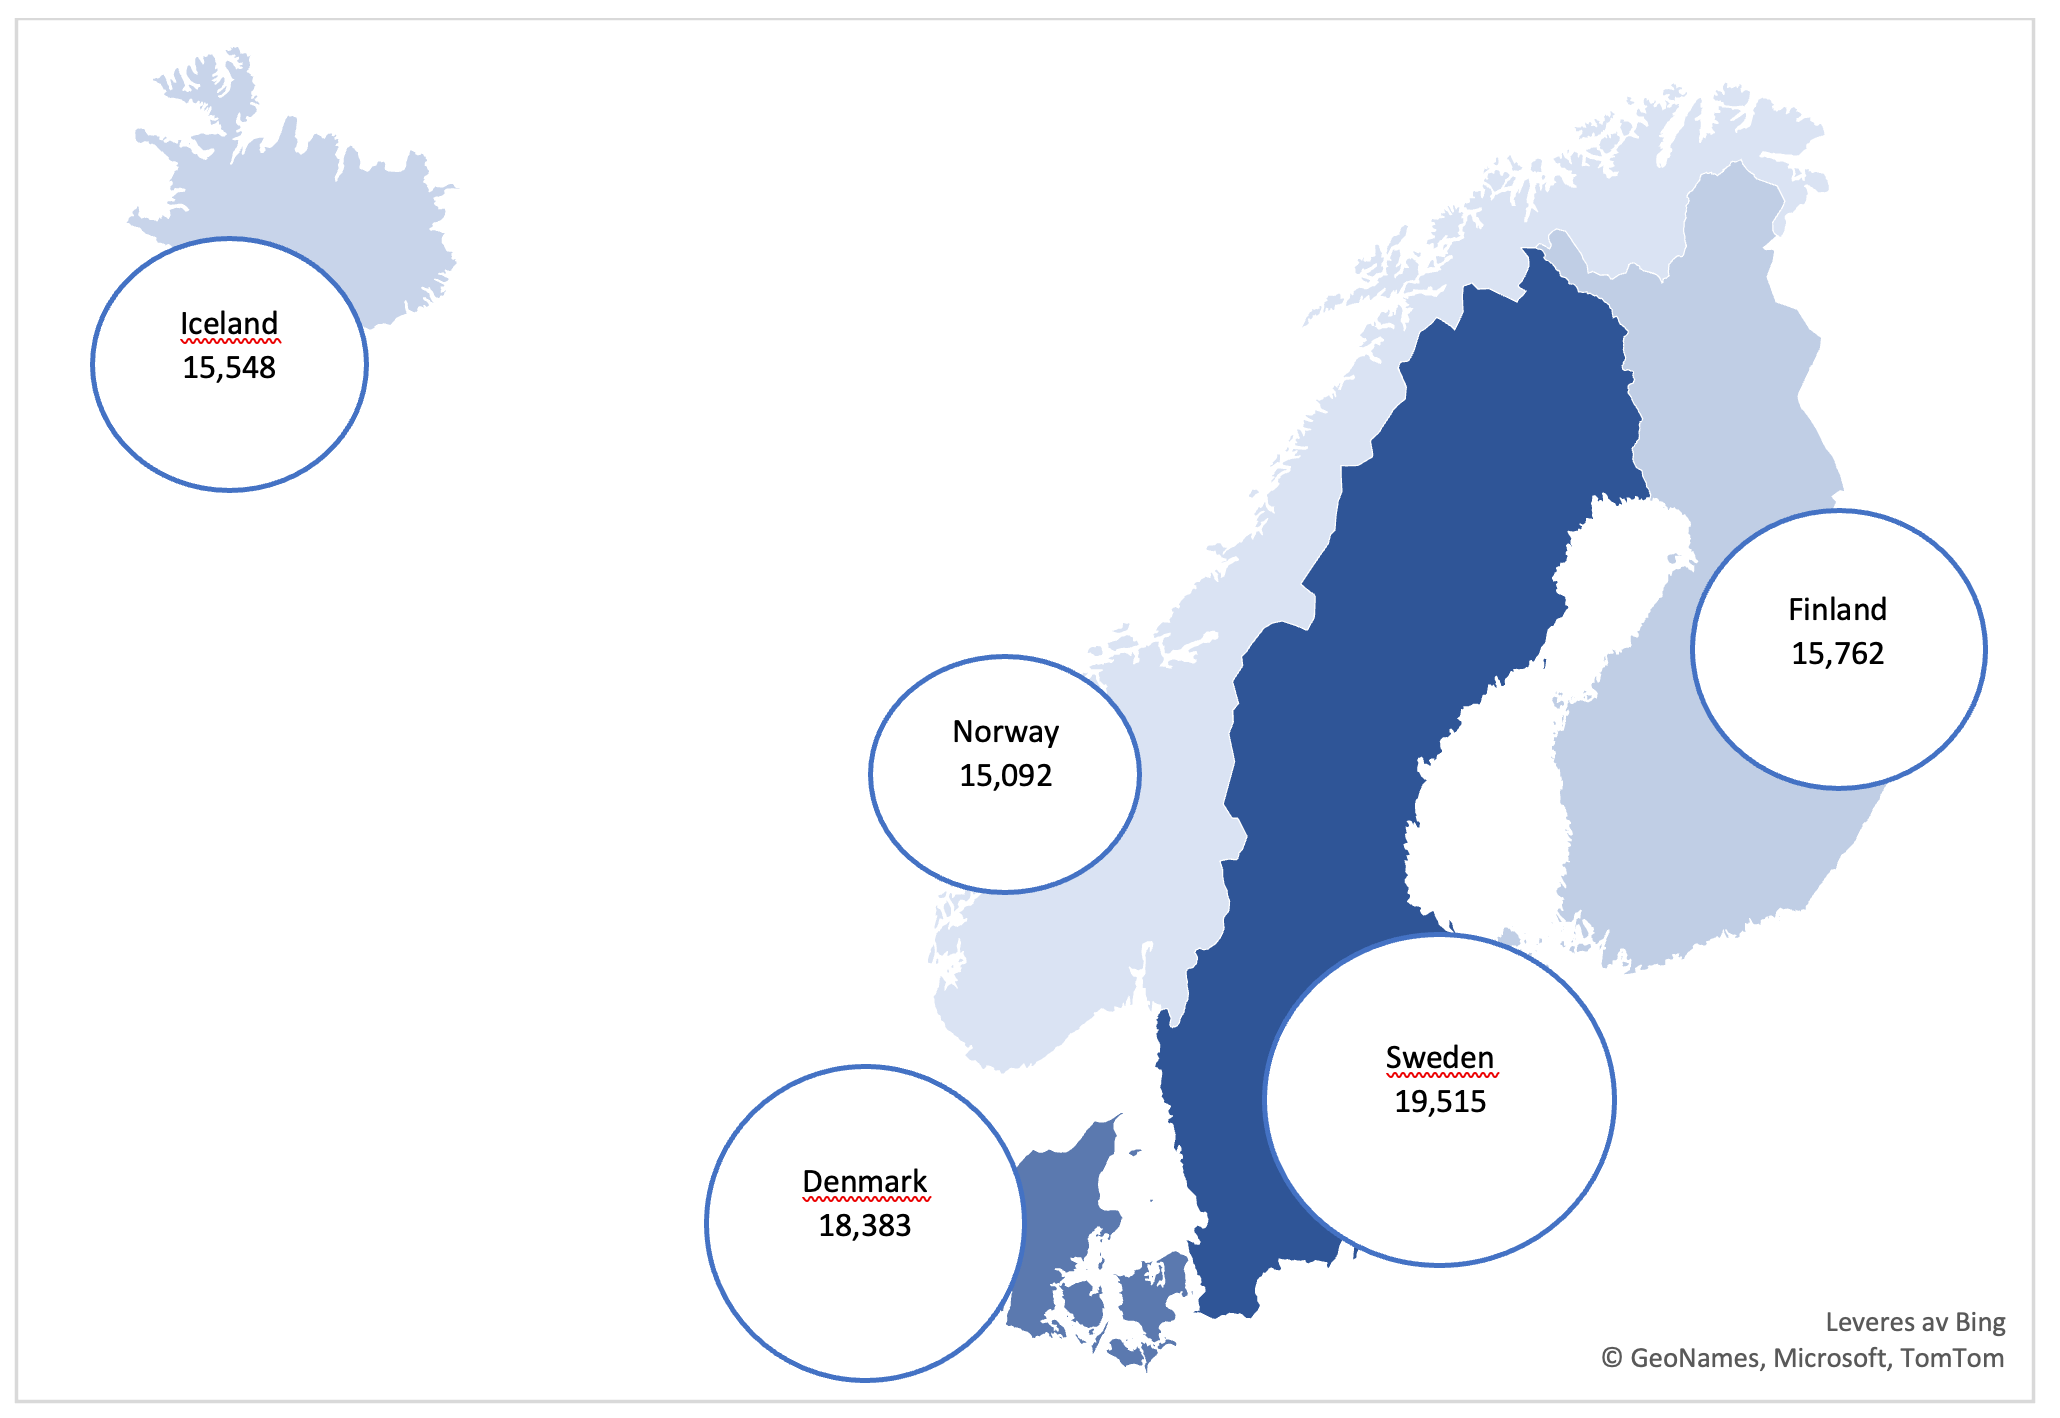
If we look at R&D expenditure per capita, Sweden is still at the top among the Nordic countries, followed by Denmark, Finland, and Iceland (see Figure 2). Norway is at the bottom and spent the least on R&D per capita in 2021.
Stable distribution of R&D expenditure between the Nordic countries
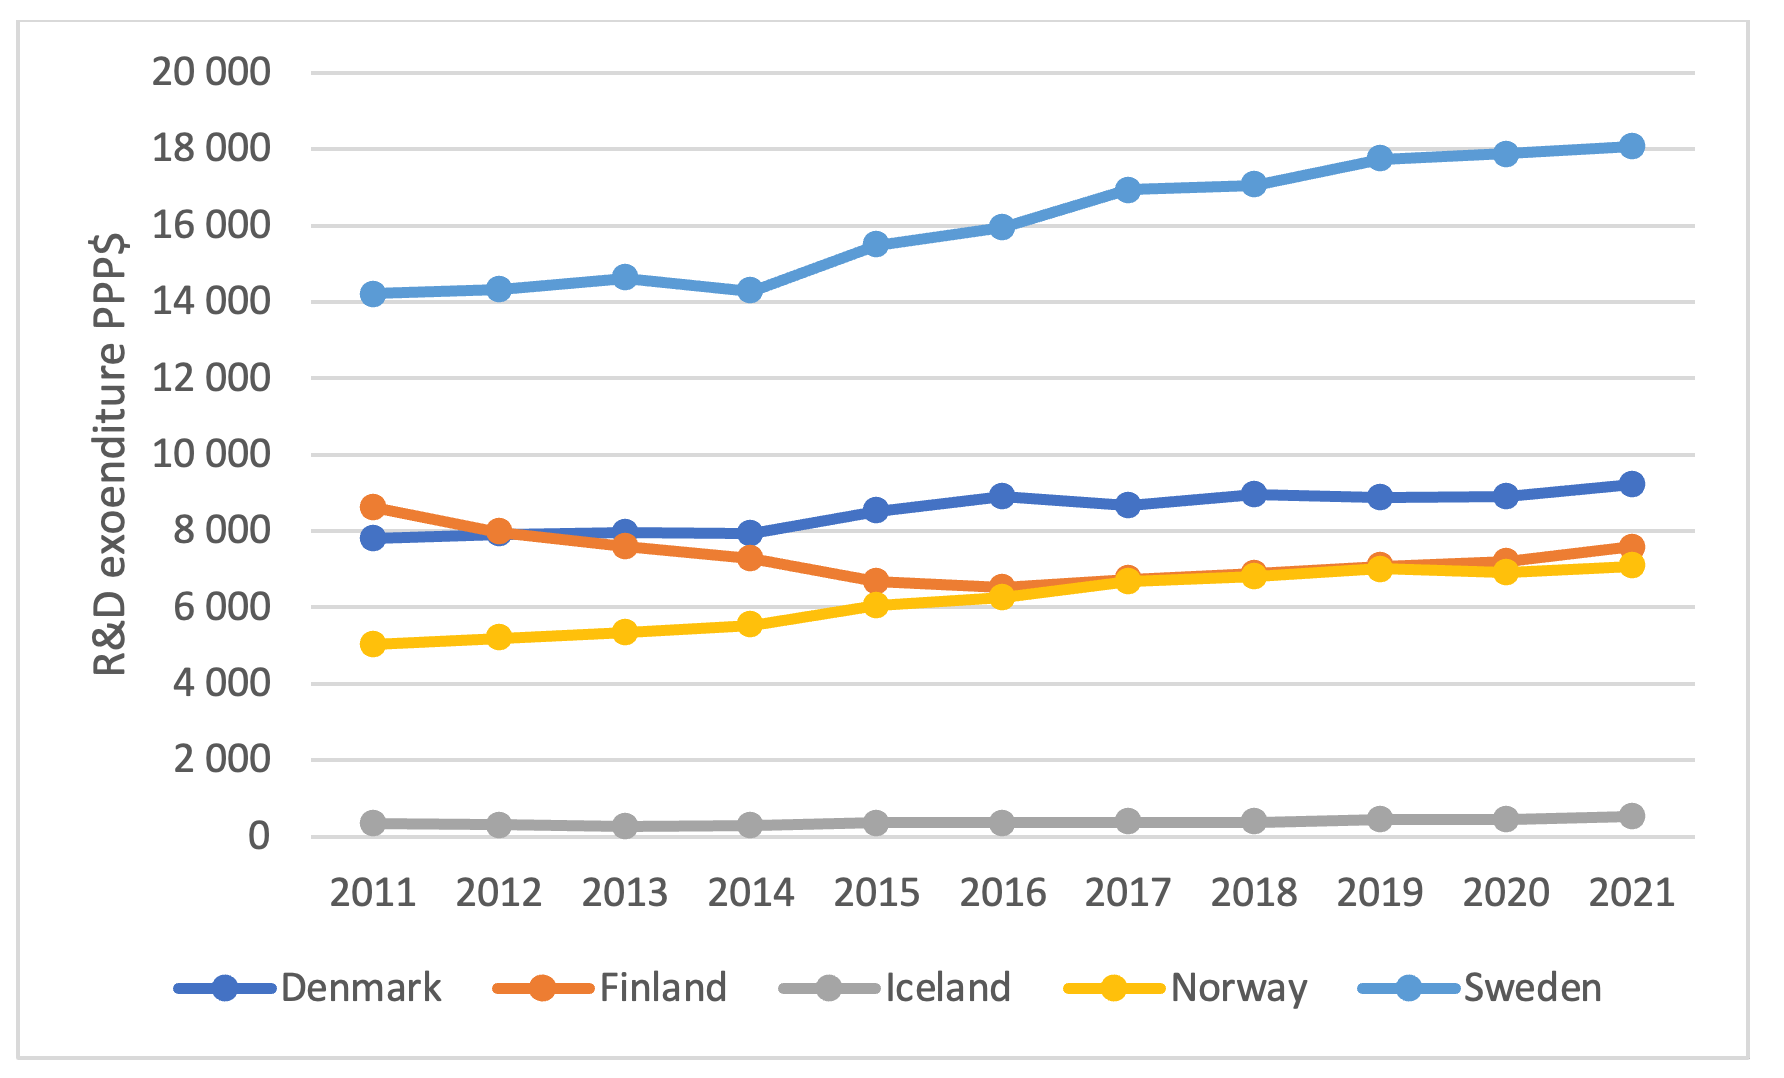
The distribution of the total R&D expenditure between the Nordic countries in 2021 was quite similar to previous years: Sweden has the largest expenditure and accounts for approximately 43 per cent of the total expenditure, followed by Denmark (23 per cent), Finland (18 per cent), Norway (17 per cent) and Iceland (1 per cent). The development in total R&D expenditure over the last ten years is illustrated in Figure 3.
In 2021, the Nordic region had an overall real growth in R&D expenditure of 2.7 per cent from 2020. Adjusted for inflation, Iceland had by far the largest increase in R&D expenditure (17 per cent), followed by Finland (5.4 per cent), Denmark (3.4 per cent), Norway (2.6 per cent), and Sweden (1.1 per cent). In 2021, the Nordic region was still affected by the Covid-19 pandemic and infection control measures, but it does not appear that this has affected the R&D activities at an overall level.
The business enterprise sector is the largest R&D-performing sector
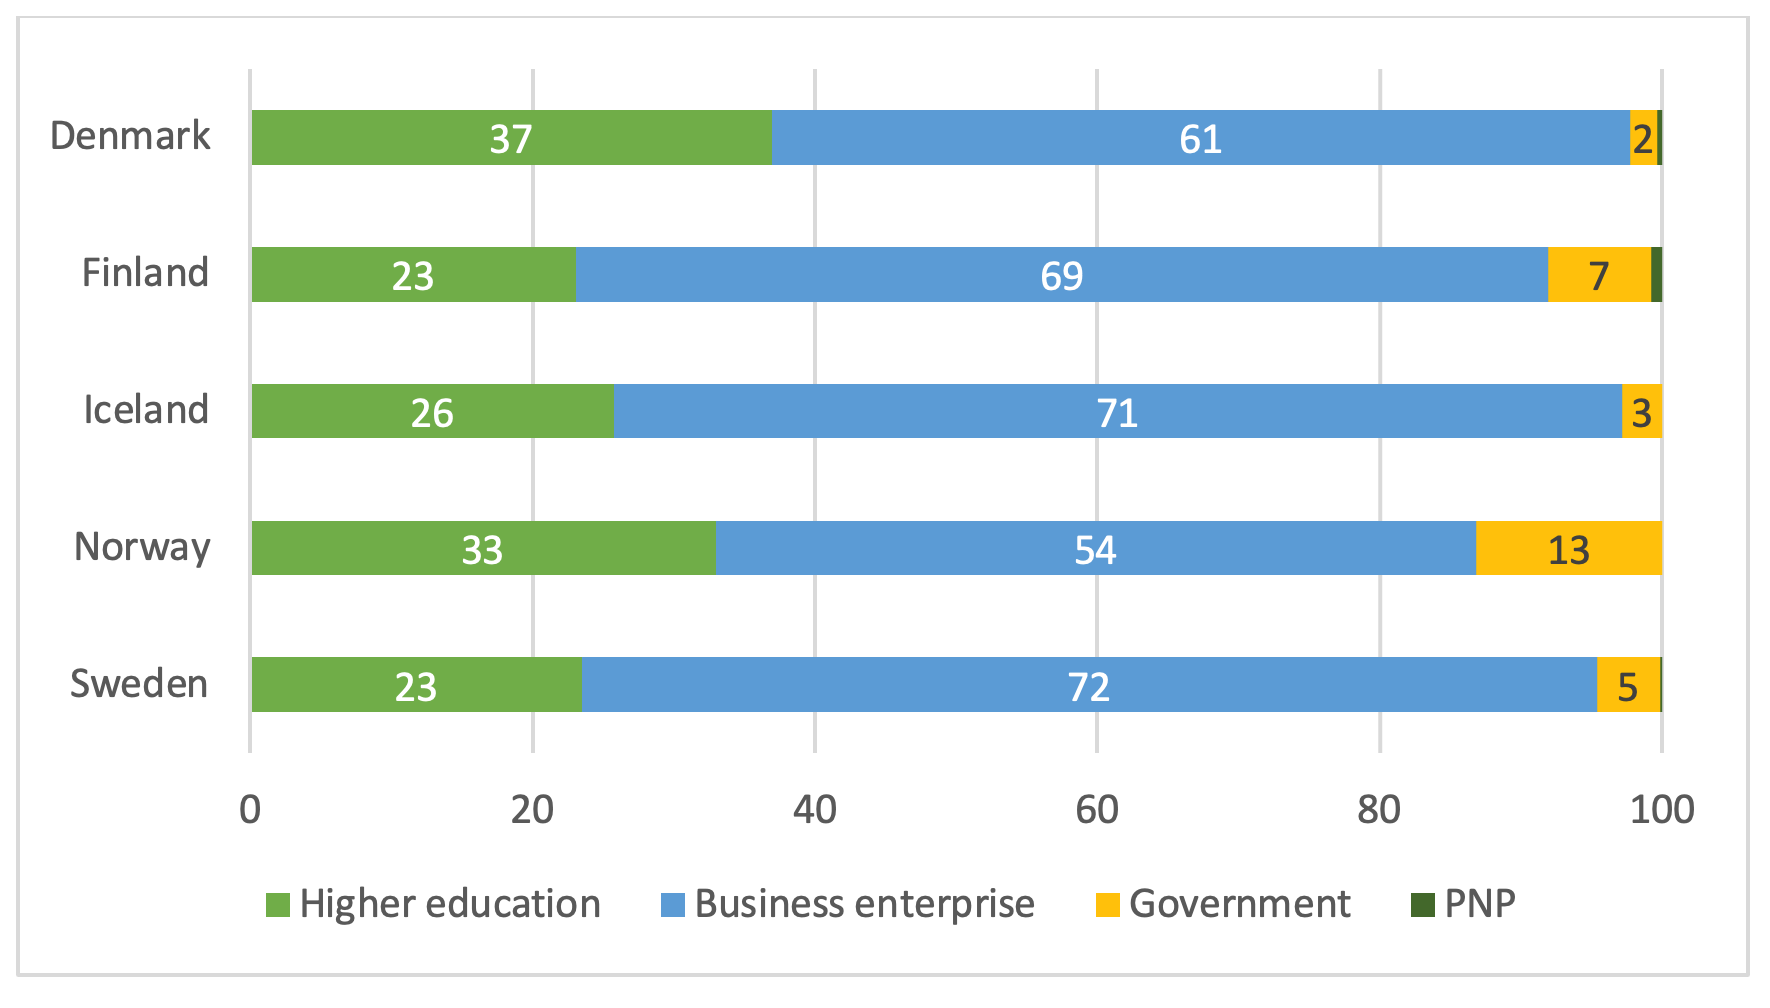
The business enterprise sector is by far the largest R&D-performing sector in the Nordic countries, accounting for 66 per cent of the total R&D expenditure in 2021. Sweden has the highest proportion of R&D in the business enterprise sector (72 per cent), while Norway has the lowest (54 per cent). The low proportion of R&D in the Norwegian business enterprise sector is linked to, among other things, little commercial activity within R&D-intensive industries.
The Higher education sector also accounts for a relatively large share of the total R&D expenditure in the Nordic countries (28 per cent). This sector is largest in Denmark, where it accounts for 37 per cent of the R&D expenditure, closely followed by Norway (33 per cent). The government sector makes up a smaller part of the total R&D expenditure in all of the Nordic countries, particularly in Denmark, Iceland, and Sweden. The proportion is somewhat higher in Finland (7 per cent) and Norway (13 per cent). The PNP sector is small in all the Nordic countries. In Norway, the PNP sector is only considered a research funding actor.
There are some differences between the countries regarding which sector who has had the strongest growth from 2020 to 2021. In Denmark, the Higher education sector accounts for the strongest growth (14 per cent), while it is the business enterprise sector in both Finland (11 per cent) and Iceland (30 per cent). The government sector has the strongest growth in both Norway (10 per cent) and Sweden (7 per cent).
10,000 more R&D full-time equivalents in the Nordic countries
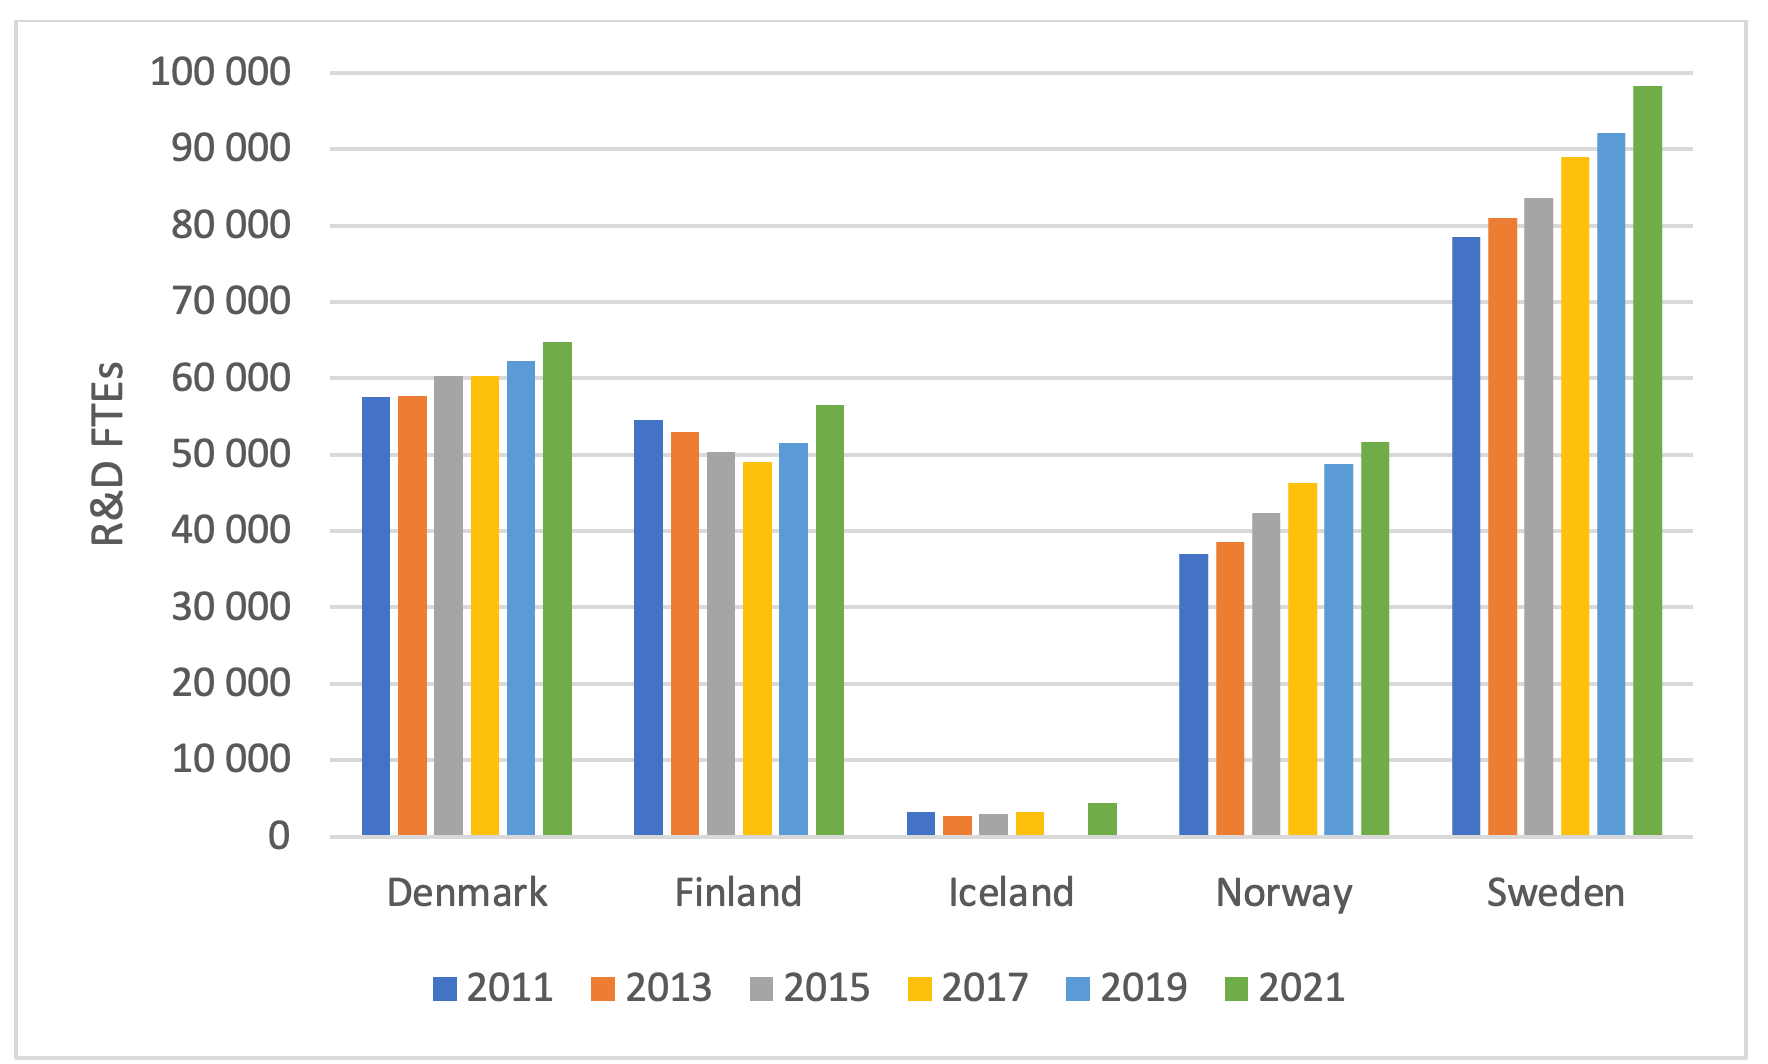
In 2021, the number of R&D full-time equivalents (FTE) was over 275,000 (265,000 in 2020). The FTEs were distributed among over 420,000 employees. Sweden, which has both the largest population and the highest R&D expenditure, naturally also has the highest number of R&D FTEs (98,285), followed by Denmark (64,722), Finland (56,488), Norway (51,659), and Iceland (4,349). Measured against the population, all the Nordic countries have a high proportion of R&D FTEs, with between 9 and 11 R&D FTEs per 1,000 inhabitants. In comparison, the EU countries collectively have an average of 6.6 R&D FTEs per 1,000 inhabitants (2020).
Since 2011, the R&D FTEs have increased steadily in both Denmark, Norway, and Sweden (see Figure 5). In Finland, there have been some fluctuations, while Iceland has remained stable at around 3,000 FTEs. However, in 2021, the number of FTEs increased to 4,349 in Iceland. If we look at the percentage change from 2011 to 2021, it is Norway that has had the largest increase in FTEs, with almost 40 per cent. There has also been a large growth in Iceland (34 per cent) and Sweden (25 per cent). The growth has been somewhat smaller in Denmark (12 per cent) and Finland (4 per cent). In total, the number of R&D FTEs in the Nordic countries has increased by 19 per cent since 2011.
The R&D staff includes both researchers and other R&D personnel (such as technicians and other supporting staff). The researchers account for the majority of the R&D FTEs and accounted for nearly 4 out of 5 of the total FTEs in the Nordic countries in 2021. However, there are some differences between the countries: Sweden has the highest proportion of FTEs performed by researchers, with 86 per cent, while Iceland has the lowest, with only 58 per cent. Finland, Norway, and Denmark are relatively even, and the proportion of R&D FTEs performed by researchers was 77 per cent, 75 per cent, and 72 per cent respectively.
Norsk versjon av denne artikkelen.
[1] This article is based on recent figures published nationally from 2021 (preliminary figures for Iceland).
[2] R&D expenditure, measured as a share of GDP, is a widely used indicator for comparing different countries’ R&D efforts. However, the indicator is strongly influenced by changes in GDP. In times of recession, it may appear that the countries invest more because the R&D share increases, while in times of prosperity it will be difficult to increase the R&D share when GDP increases more than R&D expenditure. The latter is the case for Norway in 2021, where the nominal growth in GDP was 20 per cent, and thus far higher than the growth in R&D expenditure of 5 per cent.
Illustration: Anhelina Lisna