

R&D investments go up in the Nordic area, but there are significant differences between the countries.
ELIN STENDAHL, statistician, SCB Statistics Sweden
KAJA WENDT, senior adviser, SSB Statistics Norway
Denmark shows biggest increase in R&D expenditure
In all the Nordic countries, R&D expenditure increased between 2021 and 2022. Denmark saw the most substantial increase by about 20 percent, measured in PPP$[1], while R&D expenditure in Finland and Sweden increased by about 8 and 9 percent respectively making them the countries with the lowest R&D growth rate.
In Norway, R&D expenditure increased by about 17 percent, and Iceland saw a growth of about 15 percent. The increase is mainly driven by the Business enterprise sector. However, the Higher education sector also shows relatively strong growth, especially in Denmark and Finland.

Sweden was the country with the highest R&D expenditure in 2022 and the gap to the other Nordic countries has been growing over time. In 2022, Sweden accounted for 41 percent of total R&D expenditure in the Nordic countries, followed by Denmark at 23 percent.
This relationship has been relatively stable over time, however in 2011 it was Finland that accounted for the second largest share of R&D expenditure compared to 2022 when both Denmark and Norway accounted for bigger shares than Finland.
R&D intensity in Norway drops due to strong GDP growth
R&D intensity is measured as R&D expenditure as a share of GDP. In both Denmark and Sweden this relationship has been relatively stable since 2011.
Meanwhile, Finland has seen decreasing R&D intensity over the period, being the most R&D intensive Nordic country until 2015.
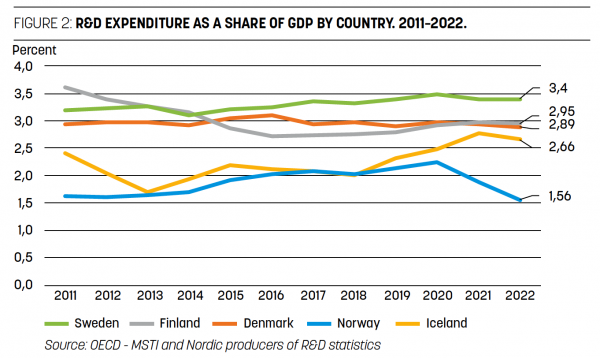
R&D intensity in Norway and Iceland has shown greater fluctuation over the time period, with Norway having their highest R&D intensity of the period in 2020, at 2,24 percent, and their lowest in 2022, at 1,56 percent. The sharp drop in Norway’s R&D intensity compared with 2020 is explained by the growth in GDP.
In fact, all the Nordic countries show a lower R&D intensity in 2022 compared with 2021 except Sweden, where the R&D intensity is unchanged despite increasing R&D expenditures.

Since R&D intensity measures the relationship between R&D expenditure and GDP, R&D intensity will decrease when GDP growth surpasses R&D expenditure growth and vice versa. As most evident in the Norwegian case, GDP growth has outpaced R&D expenditure growth in four of the five Nordic countries, resulting in a decreasing R&D intensity.
The opposite could be observed in 2020, at the beginning of the Covid pandemic, when the R&D intensity increased in all Nordic countries.
Most R&D in the Business enterprise sector
In 2022, the Business enterprise sector accounted for the largest share of R&D expenditure in all the Nordic countries. The concentration of R&D to the sector varies, however. In Iceland and Sweden, enterprises make up more than 70 percent of the respective country’s R&D expenditure, while the corresponding share in Norway is 55 percent.
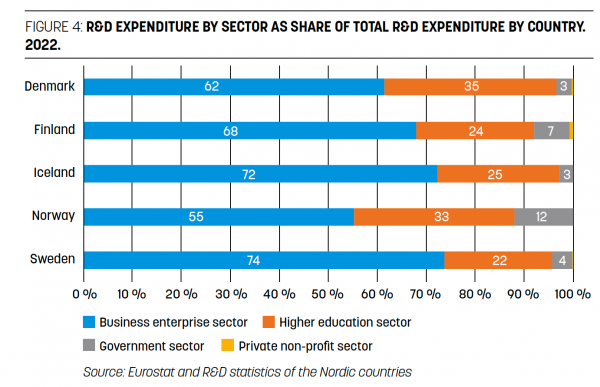
Meanwhile, in both Norway and Denmark, the Higher education sector makes up a comparably large share of R&D expenditure amounting to 33 and 35 percent respectively.
290 000 full-time equivalents on R&D in the Nordic countries
The Nordic countries have a high number of R&D personnel in the population and workforce compared to OECD or EU averages with 9,5–11,8 R&D FTE per 1 000 capita (Figure 2.3a in Indikatorrapporten).
In total, Nordic countries performed 290 000 R&D FTE (i.e. full-time equivalent employees per year[2]) in 2022, up from 275 000 in 2021.
All the countries had a growth in R&D FTE, ranging from 1 percent in Finland to around 7 percent in Sweden and Denmark. In Denmark, growth was due to a general increase in R&D activities, foremost within NACE code 72 Research and development. In Sweden, the increase was driven by the Business enterprise sector.
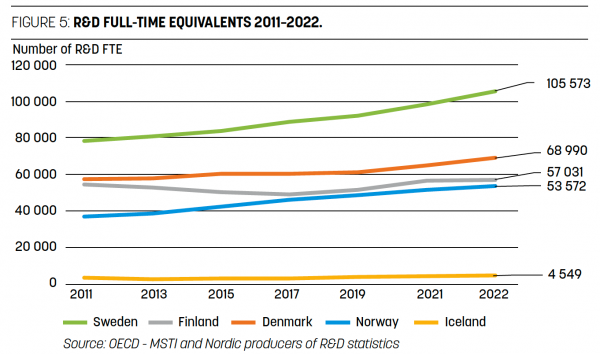
If we compare R&D expenditure with the performance of R&D FTE, Finland had a bigger share of FTE (20 percent) than of R&D expenditure (17 percent) indicating that R&D expenditure pays for more FTE than what could be expected. To a lesser degree this is also the case for the other Nordic countries, except for Sweden with 41 percent of R&D expenditures, but only 36 percent of R&D FTE.
The Faroe Islands have conducted R&D statistics for the first time for 2022. We will publish their results in this article online when their numbers are ready later this year.
Notes
[1] PPP or Purchasing Power Parity is a measure of the price of specific goods in different countries and is used to compare the absolute purchasing power of the countries’ currencies.
[2] One full-time equivalent may be thought of as one person-year
Top illustration: Galeanu Mihai